
On-Demand
|
August 2026
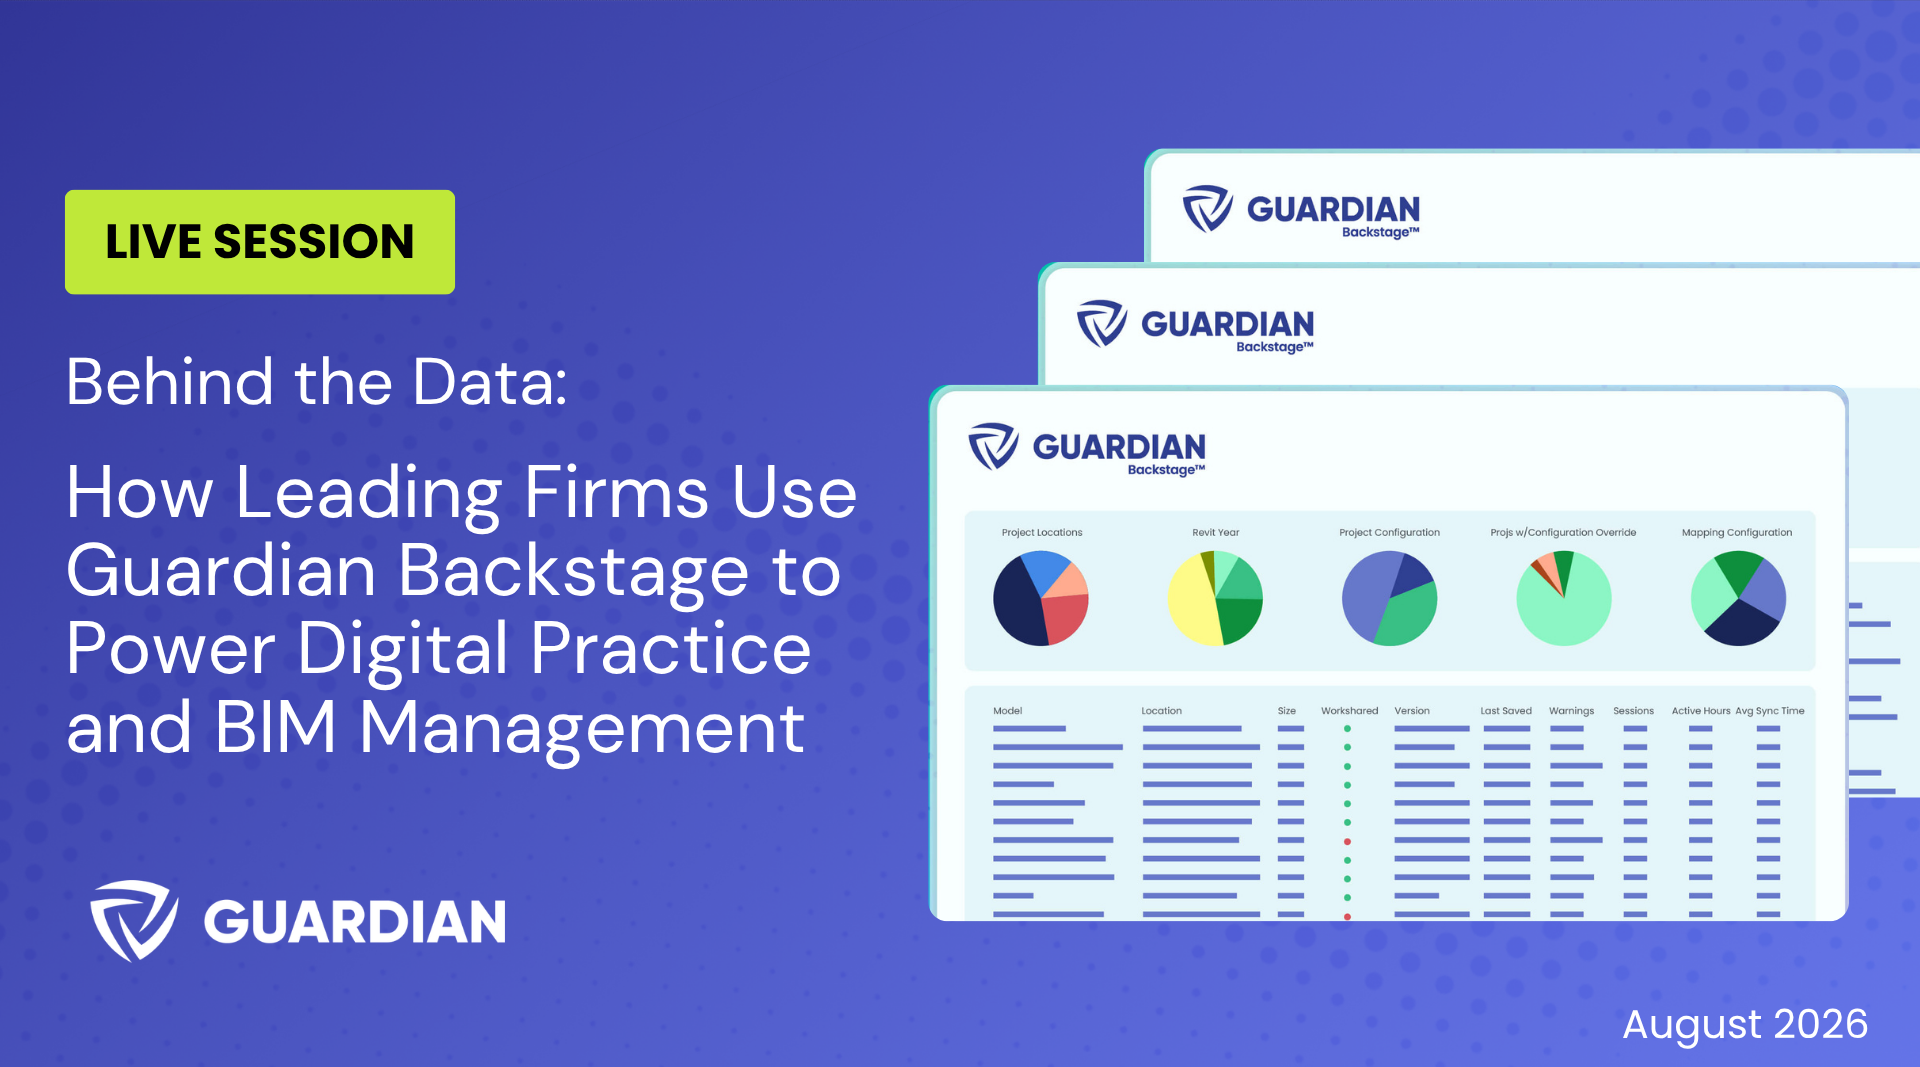
Data only matters if it actually changes how you work. In this session, you'll hear directly from Guardian clients about how they're leveraging Backstage data to strengthen their digital practice and streamline BIM management across projects. Rather than talking theory, this session puts the spotlight on BIM teams who are putting data to work every day — from improving project visibility and standardization to making smarter, faster decisions across teams.

Chris Shafer: So today's webinar is Behind the Data, how leading firms, in this case Interior Architects, use Guardian Backstage to power digital practice and BIM management. So there's a lot going on there. Now today is going to be a discussion with Michael here about how Interior Architects utilizes Backstage. If you are new to Backstage, we would recommend checking out some previous webinars that we had to get into what is Backstage and some of the details and what data is being provided. But again, this is going to be very high level.
So with that being said, let's
Let's introduce our presenters. I'm Chris Shafer. I'm the Director of Communications and Strategic Partnerships here at Guardian. And I'm happy to introduce Michael here from Interior Architects. Michael, if you wouldn't mind giving us a quick introduction.
Michael Reinersman: Yeah.
Yeah, hi everyone. I'm Michael Reinersman. So I'm the design technology specialist at IA (Interior Architects). My role focuses on firm-wide Revit workflows, model health, Revit or standards, templates, training, and user support. So we've been using Guardian for a while now.
We use Guardian and Backstage as part of a broader strategy to reinforce our, you know, best practices, you know, not just in the moment, but our initiatives and goals. So, you know, we use the data to decide where and our support and our education time can make the greatest impact firmwide.
Chris Shafer: Nice, nice. I'm excited to dive into Backstage with you and for you to really demonstrate the value that Backstage has brought to you and Interior Architects as a whole. Let's go ahead and get into today's agenda.
So we're going to go over Backstage at Interior Architects. We're going to be throwing a lot of questions at Michael. If you have questions out of the responses from Michael or you have your own questions for him, feel free to add that to the chat. And as I mentioned, Jake will be watching that chat or feel free to raise your hand.
We'll also be getting into how Michael has customized Backstage and getting into the details why and what important information they were looking to gather. Also talking about how Backstage is used for various stakeholders.
So while sort of out-of-the-box, Backstage is really meant to help, you know, those those who are managing Guardian as a whole and managing a sort of their digital practice.
But then a lot of firms are starting to think about how, what are those alternative uses for particular individuals throughout the firm? Then we'll get into future needs. What is, what's missing from backstage? And hopefully Michael has some good stuff to add to this.
And we have a few slides from Andrew at HGA. Unfortunately, he wasn't able to make it today. And then we'll get into an open ANI, or open ANI, open Q&A.
Man, so Parley, I actually want to start off with asking you a question. Now, Guardian's been around for, oh, what, eight years now? It's amazing it's been that long. But one of the things that I've always really appreciated about Guardian was...
was the data that's always been associated with it. So how did you have the foresight to make sure that it was, Guardian wasn't just a set of features, but also had the data to come along with it?
Parley Burnett: Yeah, yeah, thanks, Chris. Appreciate you asking the question and I'm glad to be here with everybody. Thanks for joining us. Yeah, it's been available Backstage for at least six of those years that Guardian's been on the market. And I would say that
You know, going back to those earlier days, Guardian had always been kind of the concept of Guardian was always, you know, front stage first, right? Like, when the rubber meets the road, what are we actually doing? Are we driving impact at the firms we work with?
If not, the data is just really kind of pointless, right? So we designed Guardian to really drive change, right? And that's what it is. It's that front stage. But if you think about kind of going behind the stage and being able to look up and see every bit of mechanics that actually...
allow that to happen. Pretty cool stuff, right? And kind of revealing in some ways good and bad, perhaps, about what's going on really at the firm. So we really just love the name Backstage. But really some of the earlier feedback as we were
kind of testing the waters with the whole Guardian idea, as I talked with friends and contacts in the industry, was the need to be transparent, right? We were talking about some big changes, some big things, some big kind of in the moment automations, and the feedback was by and large, you've got to be transparent about what it's doing.
So that's really kind of the starting point. But kind of behind all of that too is like the need to make data very, the source of data very available to the firms in case they want to use it in unique ways, you know, replicate it, perhaps customize the dashboard, merge it with their own data sources. So that's kind of the some of the evolution behind it.
Chris Shafer: That's great. And from my own experience, having that transparency and being able to show everyone, hey, this is what not only is what Guardian is doing, but the results I think is really what helps drive the overall success of Guardian within a given firm. So with that being said, I'm going to stop sharing a screen so you're not looking at an agenda all the time. And we're going to kind of get into the more Q&A with Michael here. So, Michael, we're going to start off with a couple broad questions for you regarding, I guess, broad questions regarding backstage is, What are the three most valuable backstage data categories in order and why?
Michael Reinersman: Okay, yeah, in order. Number one for me would be, and us as our design intelligence group, our design technology group, we, I would say number one would be the model health and understand the project trends because it gives us visibility into the model performance across the firm.
Number 2 would be the user behavior and workflow and their workflows. So this, with that being said, the user behavior really helps us do targeted coaching for users and
And see where standards are being used correctly and whether or not, and those type of patterns that we see within the data on the user side and on the project level, but mostly on the user side, is gives us insight to how we're shaping our education for our firm-wide, like education sessions, which we do pretty often. And then the third would be technology, the technology data that we can get from Backstage.
By that, I mean your versioning, your installation type information, your Revit years. So, you know, you're in a, we live in an industry that we're constantly upgrading, upgrading, upgrading versions. And as I'm sure a lot of you guys on this call know, like you, you know, support can get finicky if we're not all up to date or on the same version, schema errors, yada, yada. So really we can use technology as a way to work with IT and also just make sure that we're being consistent on all of our versioning for desktop connector Revit, Guardian, etc.
Chris Shafer: Nice, nice. I want to come back to what you were talking about when it comes to the model health, model performance, is what are the individual data points that you focus on from a model health perspective?
Michael Reinersman: Oh.
Mhm.
Yeah, size, warnings, and then also we look into commands of what's being done in the model. So for example, we look at strong data points of like if there's a, I have my own idea of a threshold of over too many in-place families until it starts help corrupting a model. Also, you know, the warnings that are high level, we target those as far as the model health. And, you know, we'll look at those and if it's really out of hand, we'll reach out to the teams to actually use the Guardian Messenger within the
Project Central to reach out to those teams regarding that type of this type of issues. And so Backstage and that idea of model health is we've been able to make it work where we're not looking at, or when we're looking at projects, we can.
target specific metrics that we care about. And before the model gets out of hand, you know, we talk to the team, make sure that they take the necessary steps to clean out the model.
Chris Shafer: Nice, nice. What I really appreciate about this, you're utilizing the data to be a little bit more proactive. Sounds like you're keeping an eye on trends and have, like you said, you have your sort of thresholds in mind of where things are getting a little iffy for those given projects and then you're kind of reaching out. I'm curious, you had to mention Guardian Messages. How has that worked for you? And let me ask, is when you're sending messages, how do you phrase that? How do you communicate to them that, hey, you need to do something about your model?
Michael Reinersman: Ohh.
Yeah, so I, you know, I, I would use the backstage and I, I, not the backstage, sorry, the project central, dive into that project name, and then message them on there and and give them kind of a heads up of like, these are the your top warnings, these are.
Your file size is increasing. This is why there's longer sync times, etc. So as far as messaging goes and how I use it, it depends on the project and the situation.
Chris Shafer: Yeah
Michael Reinersman: Yeah.
Chris Shafer: Yeah, yeah, every, I'm gonna say every team is a little different, every project is a little different in how you handle those.
Michael Reinersman: But I will say, you know, it's, you know, you stray away from the idea of it being big brother. It's education, and that's what people really actually do appreciate that. Like, you know, it's kind of, you know, you have, it's a guardian on your shoulder, just, you know, you're not trying to limit people, you're not trying to be big brother as far as the data, but it's there to coach and it's there for us to help you. So, yeah.
Chris Shafer: Yeah, that's a really important aspect of it. And kind of coming back to what Parley was saying about having that transparency is in some ways, it's sort of a two-way street. And the way I kind of phrase it is you can't improve anything that you can't measure.
And so it's one thing to say, hey, we're going to implement these changes. We're going to improve this and that. And if it's just sort of like an e-mail or a webinar saying, please do this, you know, some people will, some people won't. But you aren't able to really validate the effectiveness of that.
of whether that's a change or training or whatnot. So yeah, I really appreciate kind of getting into sort of the training aspect of it, having a good understanding where that training is warranted.
Would you mind speaking more about your approach to training and what now that you've been using Guardian, how you have focused on certain areas and not others, utilizing the backstage data?
Michael Reinersman: Yeah, so like on the support side, we have a pretty efficient system of how we are engaging with teams and projects. In the past, well, currently we still do, obviously we have a ticket system where if there's requests that come in where...
there might be issues on our project or they just want advice on how to do things better. So we, in the past, the idea was that tickets would show pain points and we would base our education off of those pain points that from what we saw, but really that
The data really opened it up to, that shows, and put it this way, that showed some pain points, but not the total pain. And tell you, now you have the data to really back up and see the full idea of where there might be inefficiencies on a team or a standard or also just improvements that can come back into.
into our on the DI side, on my side to make the template better, right? So when that comes into education, we used to base it more off of support hot topics, but now that we have the data, we utilize that more into our education.
We have a session every two weeks, it's called DI Download. I also have another series called Breaking Bad Revit Habits. No pun. But we have been using the data to really tailor better practice, especially with, you know, these with new hires who might not know our standards yet. And we so we can we can use that data to back up and really identify the patterns and then show how to work more efficiently.
Chris Shafer: Nice, nice.
Michael Reinersman: On the sessions, yeah.
Chris Shafer: Right, right.
One of the things that kind of comes to mind here is, and you kind of talked about this, making changes to your Revit template, but can you recall maybe the first time or the first insight that you gathered from backstage that really changed the how you viewed your
your template or your overall Revit environment.
Michael Reinersman: Yeah.
I think that, so with your configurations, you obviously set up your rules and you're getting that data back as far as how those are configured, if they're monitored, guided, etc. So there's...
What we found, where what I found as far as custom template stuff, actually related more so for maybe that it's a one-off from our base template, maybe it's a client-specific standard. You kind of have to work sometimes with your configurations to...
slightly different for a slightly different client standard, because they might not follow exactly the same standard, which is fine. But what we did is we found the inefficiencies based off the data. You ever see those screenshots on the backstage, which is
Very helpful in your commands, and and and you see you might see an action that's constantly happening, constantly, you know, someone's doing this to every single object, as far as like maybe it's overriding a graphic element, a graphic.
for an element in a view, right? So they're overriding those elements, and then you start seeing a pattern of why are they doing that? Well, they're doing that for a different standard. So maybe they're just a new hire, they just don't understand the idea of view templates, and maybe that type of project.
needs a custom view template to save some time.
Chris Shafer: Right. Kind of a sort of a slight variation on that previous question there, but is...
I would I would assume having been in your role for quite a long time and kind of doing it.
without the data, now that you have the data, do you think there are some things that kind of challenged your previous assumptions or really forced you to really change some pre-existing ways of doing things?
Michael Reinersman: Yeah, yeah. I mean, I think absolutely. I mean, several activities like we, that we initially viewed, we thought of as like more isolated support issues. But once, now that you see the data and you can start seeing that.
it might be more widespread type of habits or issues, then that kind of changes our response from our team, rather than just like one-off troubleshooting for that, then it becomes more...
more coordinated approach to do education on a broader level, I would say. So it's not always just like a one-size-fits-all. It varies on the situation.
Chris Shafer: So what I hear is pre Guardian, you're really relying on the ticketing system to.
Michael Reinersman: Right, so yeah, yeah, that sorry, yeah, that's exactly right. You know, before we were, it was just the ticketing system that we're seeing these isolated things, but tickets weren't showing, they were showing like, you know, one small pain point or one small problem, but not a more.
Now that you have the data, we can see how it relates to all projects across the firm, which we have thousands of projects. And, you know, we have our DI support team that helps everybody out. But to be able to capture all the trends together, the data does a good job at
Doing that for us.
Chris Shafer: Yeah, I like that. That's a really important sort of subtlety there is you're relying on your tickets and you're like, well, obviously these are the bad things that are happening, but you didn't have any further context. And then once you got that further context, you could say, well, this is this ticket.
is a one-off, while this ticket is, it's much broader in nature, but no one's speaking up about it. And I would assume that's probably one, with the size of an Interior Architects, that is one of the big hurdles is actually knowing what's happening inside those models and what are those actual.
pain points or needs or training.
So, with, yeah, with that is...
Michael Reinersman: No, 100%.
Chris Shafer: It sounds like you've been able to kind of determine trends from that, where again, the ticketing system is an indicator, but then you look at the raw data there. How do you focus on using these trends to help? It sounds like in individuals you do the training.
But maybe at a project level, how do you, you know, what are the data points that you really focus on? I know you mentioned earlier some of the model health items.
But how do you use backstage to help on that side?
Michael Reinersman: Yeah.
So with Backstage, you have, it's all the same data. I'm just going to tailor this a little bit into, you do have different groups that you target, that you want to target based on different scenarios. So we've worked through custom dashboarding.
with automatic refreshing online. So we've worked through users as an example to understand more specific tailored commands and warnings, what might be trending in their realm. Then projects. So, you know, we talked about projects, we talked about
You know, your model health is the most important thing in all this. So your warnings, your commands, your sync times. Also, what's your easy wins in the dashboard? There's a tab in there that's called easy wins, right? So there's the idea of sync conflicts.
Chris Shafer: Yeah.
Michael Reinersman: Making sure that those projects aren't over the threshold of modeling in place or imported items, right? So there's that, there's that project level, and then there's other data that is more tailored to the support side, which I saw a question go there that someone asked, what is DI? Sorry.
I'm not on an IA call right now, but DI stands for Design Intelligence. That's our group that we call ourselves for at IA. And then also there's the bigger, there's the other.
questions of like, there's the other data that goes to IT that we kind of customize. We have customized tabs that for IT purposes, and then big picture idea of trends for leadership.
Chris Shafer: I want to kind of pull on that customization a little bit further, but before we do so, I'd like to, we have a couple more polls here that I'd like to launch. So Megan, if you wouldn't mind launching the next poll regarding of people here who are experienced with Backstage, what is your favorite?
backstage tabs or groups of data. So what I'm going to do quickly here is I'm going to take a little...
I'm going to present my screen here.
And, and so...
If you're new to Backstage, you...
You have the tabs along the bottom. If you go to your home screen, you will see all the various tabs laid out here. Just as an FYI, if you want to use this as your navigation within the desktop version, you have to hold down the Control key. But I do want to jump over here to the easy wins, as Mike was referring to.
Now, this is our Client Success dashboard that we maintain our own models here at Guardian with. There isn't much data, but...
But I just want to highlight a few of these things and and what we find a crime across the board is these are the most common
protections that are being utilized across a firm. And so throughout, for a large firm, these numbers are going to be in the probably 10s, if not hundreds of thousands, and how active Guardian is. I just want to make sure everyone is aware of these
these different tabs that gives you different perspectives on your data.
Now, before we get into how you customize.
that there is one other pool here about, and you've hit on this, Michael, is what types of data is important to.
To model performance and Megan, if you could launch that full.
And you're more than welcome to select multiple here.
I know you mentioned in-place families there. I'm going to say a handful of people go to in-place families.
Michael Reinersman: Yeah.
Chris Shafer: But I think it's all degrees, right? And so obviously file size and sync times are always the sort of the top of that list. Is there any other items on that list in the pool that you really focus on that you haven't mentioned, like number of link models, link CAD?
Michael Reinersman: Yeah, I think actually when it comes to model health is, you know, someone actually just mentioned it in the chat, but not just file size, but your family sizes. And so the one thing that I like to use backstage also for is the seeing where families are coming from. Some firms, they lock down.
all their sources, but what we do is we educate better about how to create, you know, if we're taking downloaded families or we're going custom families on how to make them most efficient, because then Guardian is also, when you're importing it, it's cleaning up the properties that are from the family, which is helping.
For sure, but you, what's I what I like to see is is like where they're getting it from, so we use UNIFI or sorry, now we'll use content catalog as a source, so, or but we can also see if it came from downloads.
Um, or other, if it was copied from another project, that type of information.
Chris Shafer: Nice, nice. I want to go back to the customizing backstage is one of the things that the way that you responded initially was really talking about the various stakeholders. And you talked about the users, IT.
and leadership. Can you elaborate a little bit more on...
On.
what type of data that you wanted to see for each of those stakeholders.
Michael Reinersman: Yeah, yeah, I know, so I mean, if, if you're if I'm talking to a project manager, it's gonna be project-specific health indicators, so we we have created more of an interface that is more specific to what we're...
what we're searching for. So obviously you're getting a lot of data that's coming out of this Power BI template that Guardian provides, but you can mitigate and create your own tabs or create your separate copies. That's more pinpointed on the different groups that you're looking for. So for example, if I'm going for a...
of project information. We've, I don't want to get through all the details, but you know, being able to quickly find the database off of your project name, search to there, and do the metrics that those stakeholders would care about.
And another part of this is like our Revit leadership. So we have a Revit leader in every single office. We have 2021 offices through the US and London. And I meet with them three times a month, at least one of the sessions or twice.
or sessions as of lately, I've been really going over kind of the trends of the Guardian data. So when they go back to their office, if they have their weekly meeting, their what we call rug sessions, they're able to start to talk about better working habits and what we're seeing.
So...
We're a big firm, so there's that's what makes the job easier is having that data right there and then be able to distribute and see like what those what those efficiencies are.
Chris Shafer: I think it's amazing that you, one, you spend three times a month meeting with them. And in addition, you're providing them the data of what's happening inside their office to help them be better at their job and help their users be better.
Can you?
I want to say, since you have so many offices, that's kind of broad picture here.
Do you find that there is common?
issues across the offices or are the offices unique?
Michael Reinersman: I know, I think it's more common. I mean, I don't look at it as a basis, but I look at it as a whole. We also have, we look at just more on a project level basis rather than, you know, individual offices. And yes, it can vary here and there just based off of experience.
But I think that the information they, like I said, it's all education there to coach and they really appreciate that. And it because it puts everyone on the same playing field of
Training.
Chris Shafer: Yeah, yeah, I can imagine this being really helpful, just knowing that.
We've all been in, we've all been there where there's just webinars and training sessions, and you just feel like it's such a broad net of information that you kind of walk away and you're like, "God, you know, maybe got one little..."
Smidgen of that, but ultimately what you want is, you know, to go there knowing you're gonna learn some things to be really helpful, and you're utilizing that data to say, "All right, this is where we need, where our users need that help," and you're able to kind of focus that. Can you, you talked earlier about, you know, how you've used that data from from a training aspect of it.
Has it changed the way in which you've been?
training people where it's one thing to know what the needs are, but it's another thing to say, this is how I get better at training our teams.
Michael Reinersman: Yeah, I mean, there's always obviously been the training before and after the backstage data. But looking at, I mean, before backstage, the training topics were driven largely at, let's say, from the support requests, like I said earlier, and more so of some assumptions. But now today, it's more.
the idea of identifying those reoccurring patterns on projects that might become larger problems in model health. And then creating the targeted content from that for the groups or the users that need it is...
Is is crucial in the idea of coaching and I and coaching and education, so it it doesn't ever it the conversations did not, you know, it doesn't replace the conversations at all with users or the teams, but it what it does is it makes those conversations more relevant.
based off of the data and using limited training time more effectively. So because my theory also on the training time is to be short and sweet more often, but do it short and sweet because nobody wants to be in an hour-long webinar of me talking of
Thou shall. No, but it's just coaching. And then really also with that, when you start really digging into spending time and looking at those patterns, it's coaching me also on the BIM side to.
I, I see stuff with, you know, imported families, like, why are we always copying this family? Why, what, you know, does it need to be in the template? Probably, or, or why are people modifying certain?
view templates or why are they not using the view templates efficiently, stuff like that. Or, but really it's a coaching thing for me too because not everyone's going to send in or tell you every single nitpick item in a support ticket or, but now you see a broader scope.
That actually, you know, it's coaching both sides.
Chris Shafer: Yeah, speaking of tickets and feedback, is how often does your teams utilize the comments and the command messages?
Revit feedback.
Michael Reinersman: Uhh...
Yeah, they use it. They use it. And I, to be honest, I need to do a deeper dive into it, but I have changed items in the past based off of those comments.
Chris Shafer: Oh, nice, nice. Yeah. And that's really the purpose of those, right? Is now you're creating that feedback loop, right? So yeah, because it's, I could imagine the amount of users you're supporting.
Michael Reinersman: Yeah.
Chris Shafer: You think you're making the best decisions?
but you don't know until you actually get the data in return. And sometimes that data is just comments. I got another question for you on reviewing the data. Have you used any AI to review your data?
Michael Reinersman: Um...
Within Guardian? No. Well, I have. I've been testing out some tools. Yes. But now I have not used the AI as far as Copilot in Power BI. I've done some extractions from Power BI and I've used
I've used it to pinpoint more; it's honestly more so on the on project-specific stuff, just some trends and getting those quick answers with Copilot.
Chris Shafer: Right, right. Yeah, I'd be curious and if anyone else here has used AI to glean more insights from the backstage data, please add it to the chat or love to hear more about it maybe in the Q&A. So coming back to stakeholders. Earlier, you mentioned IT and you talked about versioning. Can you elaborate more why?
Why having that data specifically to hand to IT, especially versioning, has been helpful for you and ultimately your end users.
Michael Reinersman: Yeah. And also, I mean, also, it's not just the versioning when it relates to IT, but this idea of where your files are located. So for example, we require everybody to be working on Forma. That opens, that's the best collaboration platform we have. It's better than using it on your local drives.
et cetera. Now, when it comes to versioning on a support side is, like I've said earlier, is Autodesk comes out with point releases all the time. Sometimes if you're on 2026.5 versus 26 point.
4.2, you might have a schema error. And the quick fix to that is just like, all right, make sure you're upgraded to the same version. You know, maybe you're out of the office, maybe you're on vacation, someone might be causing that conflict with work sharing.
Chris Shafer: Yeah.
Michael Reinersman: So that's a big practice as far as looking at like quick wins as far as like when I'm doing a support ticket and it's a model issue. And I see either like schema errors, syncing errors, type of something like that, looking at the versioning, getting everybody upgrade to the same version that usually.
Ops, fix that.
Chris Shafer: Nice, how, how did ohh, sorry, go ahead.
Michael Reinersman: And it.
And then, like I said, too, is is you know file locations matter with speed, so making sure that we are staying true to our standard of making of all of our links of of all of our links and all our models are on Forma.
Chris Shafer: Yeah, I noticed in the chat there was a question regarding, can Guardian make sure the links are being hosted in particular locations? So it sounds like that's, I guess, a future need for you as well.
Michael Reinersman: Ohh.
No, yes, that would be great, as as a..
Now, I mean, but we could use backstage in that realm of like, you have that umbrella of your projects from Forma, and then if they do open up that link model, it's going to register.
Chris Shafer: Yeah.
Nice.
Michael Reinersman: But, but if you don't open up that link, I don't know if it registers. I don't think it registers, right? Yeah.
Chris Shafer: No, unfortunately, unfortunately it does not, at least at this moment in time.
Regarding the IT and versioning, how did you handle that before Guardian?
from a DI perspective.
Michael Reinersman: A lot of more communication of reaching out, bugging people to tell me what version you're on, rather than being able to just dive in the data and be like, okay, you're outdated. Let's get you pushed up.
Chris Shafer: Yeah.
Michael Reinersman: But I don't have to wait for a response now, because I already know. But also, I mean, our IT team will, they can run a scan to see the success rate of versioning.
Yeah.
Chris Shafer: How has your IT team responded or appreciated you helping them keep up to date on all the software?
Michael Reinersman: Oh, they love it. They love it. Yeah. I mean, the installs tab alone, just going there and being able to see that. Because the other part about that with versioning is with Autodesk, for example, what is every three or four years, they leave one off. So was it?
2023 they don't support anymore, I believe. So being able to look at projects and be like, hey guys, it's time to upgrade. You know, you might have a, sometimes you might have a client that will give you pushback or you're not the lead on the project, but.
or maybe the client is requesting, no, it has to be a legacy project in 2023. But for the most part, we push everyone, try to push everyone to the latest version. But when we do that yearly removal of that oldest version, we look at those projects, collect that data of which products they are,
then reach out to all those individual teams, we actually just did this, to let them know, like, hey, you have to upgrade. Otherwise, your projects are not going to be compatible with the latest plugins either. I mean, plugins follow the same suit of the yearly.
Um, releases for with with Autodesk.
Chris Shafer: So it sounds like where maybe before it was sort of a haphazard approach and you didn't know what projects were on what versions and probably had to wait until an add-in or something within Revit wasn't working right before that, you know, that project was flagged being outdated.
And now it kind of puts you in the driver's seat, making them a little bit more proactive of getting teams upgraded. That's.
Michael Reinersman: Yeah, 100%, yes.
Chris Shafer: That's awesome. That's awesome to hear.
Kind of kind of winding down, and because we want to get back to a little bit of the some of the slides here, is is what is what do you what would you consider the single most valuable question that Backstage helps you answer as a firm?
Michael Reinersman: Um...
Training and education. I mean, well, it helps us prioritize support. So like I said earlier, is that
you know, where should we focus our limited time sometimes to achieve a better educational and support impact? Well, the data itself helps us prioritize based off the metrics, our support, our training, our standards development,
and strategic initiatives that might need to be implemented based off of the data into our templates.
Chris Shafer: When it comes to these strategic initiatives, how has it helped, I guess, the success rate of those, whether it's getting approval to do it in the 1st place or once you get approval, kind of validating its success?
Michael Reinersman: Yeah, I don't know how to answer that clearly, but I would say yes and yes to both of those, that it's giving you the reasoning and you're backing it up with the data. Before the, you know, before having the data, it was more of an assumption, now it's true reasoning.
Chris Shafer: Nice, nice. And it sounds like kind of taking it all in and everything that you kind of talked about today is that you're using the data more from an operational oversight. And again, not from like a big brother, like, hey, these are the areas that need.
need help, need improvement, where training needs, where support is needed, where IT is needed, and future initiatives, all this kind of comes out of that data that's being collected within backstage.
Michael Reinersman: Yeah.
Chris Shafer: Nice, nice. One last question before we get back to the slides is what data or insights is missing from Backstage that you really want?
Michael Reinersman: Ohh.
Yeah, it's a good question.
I would like to see, like, you know, you mentioned AI earlier, but, and I don't know if AI is the answer to this, but seeing more of a deeper connection between user behavior, model health, and then, like, I'd say project outcomes and being able to kind of trend mark based off of...
past projects. Maybe it could include more predictive risk factor indicators or factors like that would flag you. Or also just, which I've done this where I've done alerts on Power BI on the web. And sometimes you have to turn it off because it might.
Chris Shafer: Yes.
Too much, yeah.
Michael Reinersman: Get a lot of emails, but the idea of like, okay, here's a predictive risk indicator, and then, you know, it's trend forecasting that way, but maybe we can either, you know, see it quicker.
you know, isolate you to that project, to that model quicker, based off of like more predictive analysis. I think that...
Um, I, I think that it also...
other options would be like...
You know.
project number connections. So I think that having the ability to connect the data on the back end to your project numbers, that way you can swipe through based off of project clients.
Et cetera, connecting data to connecting data to a bigger database.
Chris Shafer: Yeah, understood.
But...
Understood, understood. Yeah, so it sounds like really what you're looking for is right now, and I think I saw something about a fire hose of data right now from backstage, and while backstage...
does a lot to kind of hone into the underlying issues. There are some connections there, further connections between the datas that could be realized that currently isn't. And then kind of be proactive in addressing some of those underlying trends. And then.
And it sounds like...
A couple more data points to help tie things in better and be able to get it out to your particular stake quarter sounds like is another need there. Yeah, we'll definitely make sure we take a look at that. So what I'd like to do here is if you have any questions for Michael, here in a couple of minutes, we'll have a live Q&A.
feel free to continue to add them to the chat. But I'm going to go ahead and share some slides that Andrew from HGA has shared with us. So if you can just give me a second here to get us back into PowerPoint.
I know everyone loves PowerPoint.
And that's alright.
So as I mentioned, Andrew Branch from HGA had shared these slides with us, which I found really interesting in how he utilized these given customized dashboards he's created. So
So what he does is on a weekly basis, he reviews these two slides. And the first one is, as you were getting at Michael, is just checking software versions. So when he comes into Power BI, and in my conversation with him, it sounds like what he...
really appreciated was, you know, he's got 20 minutes at the beginning of the week, how to focus this, how can he focus this time to make sure that these, as you were referring to, Michael, these sort of simmering problems don't become bigger problems. And so he goes back and looks at the date range, changes to two weeks.
Then you kind of just goes across the board and start looking at the various data, or excuse me, the versioning out there. Where what I really liked about this was getting into first and foremost the out of date Revit builds.
And then looking by users, which users have those out of date so he can focus his time on not sending broad emails, making sure that your Revit version's up to date, but saying, hey, user so-and-so, please update, right? And then they can validate that's happening.
And then desktop connector. I was, I want to say when I saw the slide, I was really impressed that how, how.
on point and how congruent all these installs were across HGA.
And this little aspect of the dashboard was really interesting, where what he did was basically gave himself a score on how successful those installs are. And so when you notice here on the Revit builds, he was looking at what percentage of...
each of those are out there. And then...
Again, getting into like Guardian, it looked like he had a, I would say, a near 100% success rate of install of Guardian. And the same thing with Autodesk Desktop Connector, where 98.3% of his users were all on the correct version.
which is quite impressive. And I think this kind of gets back to that productive nature that you're talking about, Michael, was how he...
This gives them the data to make sure that those problems that exist because of incompatible or inconsistent versions are at least that low-hanging fruit is addressed first and foremost.
Michael Reinersman: Oh yeah.
Chris Shafer: The other dashboard he created here is what he called project size versus open time. And so the way that he spoke about utilizing this was how to focus his time and his team's time on what projects to prioritize. And again, Michael, it sounds like you've done the same thing as well with your...
with your local Revit leaders.
And what you can see here in this table here, top priorities, he is filtering these just simply by file size, open time, and sync times, and knowing which models, which I, again, coming back to having 20 minutes to figure out, hey.
How am I and my team going to prioritize our time? These 2 slides, I think, really speaks to a lot of those simple things that you can do and how you can use this data to help you be better informed. All right, with that being said, let's go ahead and open up to any questions that people may be having.
And Jake, if I could ask you to monitor the chat, if there's any questions that came up throughout the presentation, feel free to bring it up. If you have any questions for Michael, feel free to raise your hand and we can unmute.
Jake Martin: There aren't too many outstanding questions.
Got one from Benjamin Nix directed for you, Michael. How big is your firm and how many users total and how many do you have in your DI group?
Michael Reinersman: Mhm.
Yeah, so our firm, we're, like I said, we're 20 or 21 offices in the US, also in London. And we have 550 to 600 currently. Yeah, a little.
little over 560-ish. So, or 575, around there. And our DI group, there is six of us. And we all have strategic roles in what we do. Obviously, minus the
Revit workflows and support and templates and really working with our add-ins and our future technologies. But we also have education, someone on our team that's dedicated for education now and among other people doing other roles with.
AI, et cetera.
Chris Shafer: So you have roughly, I would say, 1.2 to 100 ratio there.
Michael Reinersman: Yeah, and that's yeah, and that's why Guardian's a good extension of our team. It helps.
Chris Shafer: I, I'm gonna ask, I...
That was, it was gonna be my question. That was gonna be my question. Yeah, sounds like Guardian helps extend those capabilities.
Michael Reinersman: Mhm.
Oh, for sure. Yeah, it does. And it gives a totally different insight of and being able to capture information and data way quicker and helps out on the support side, education side, like I said.
Chris Shafer: So it sounds like it really multiplies your capabilities with the limited team that you have. So yeah, nice.
Jake, any other questions there?
Jake Martin: This is generally to the group. Sylvia asks, when can we expect to see a user guide for Backstage?
Chris Shafer: Oh, user guide for backstage. I will say we have done webinars where we really get into the weeds of backstage. And I think that might be a helpful place to start. You're right. And at this moment in time, everything is pretty high level on our website.
But the, I think those web those in-depth webinars will go a long way to help.
Michael Reinersman: Another idea with that is with the templates of your base template is including more tooltips. For my custom dashboards, that's where I really gained the most success is using the tooltip function in Power BI to explain what this actually means to the user.
Chris Shafer: That's a good note. I'm gonna pass that on to Kenneth, so...
Take any other questions?
And thank you for...
Jake Martin: No, I think everything's been answered.
Chris Shafer: Great.
Well, I can see, actually I see another question that just popped up here. Do you ever show backstage to non-BIM leadership?
Michael Reinersman: Is for me, yeah, obviously, obviously, yeah, I, I, I do, but I do it very strategically, and that's why I said I have custom dashboards that's for situational type purposes, and the reason being is that I don't want..
That we we don't want data to be compared comparative of of like a user comparing themselves to somebody else, but we want it to be education focused, so we do we do share it, but we share it at a project level and.
I kind of relate this back to what you see. Well, my kind of like explanation to this is like, so users already see the data on their own projects using Project Central. So if they wanted to, they can already go ahead and see what other users are doing on your project.
So the answer is yes, but I am strategic on filtering out data that gets straight to the point of each user group.
Chris Shafer: Along those lines, do you think that has been received well? And have you been able to see tangible improvements to the way projects are executed?
Michael Reinersman: Yeah, no, in the beginning, there's always that little of like, oh my gosh, I'm being monitored type of feeling, or it might just be quiet. But as time goes on and then you start talking and you utilize that data through education,
where people want to learn. At the end of the day, people want to learn, they want to be better. And it's not, we don't use data to push people down, but we use it to elevate our teams. Truly, people that everyone wants to get better and they appreciate those insights because they're
You know, everyone's on a grind. Everyone's, but being able to get those quick analysises and being able to coach with that data is people become more appreciative of that and get more involved.
Chris Shafer: Yeah, so it sounds like in coming back to what Parley said at the beginning was the goal was to be more transparent here. And really what you're doing is putting transparency in the system and making sure that that transparency is being used for the good of everyone, and especially
ultimately helping the individuals doing the work, doing it better, really helping them to be their best selves as well.
Michael Reinersman: Exactly, exactly.
Chris Shafer: All right, uh, Jake, any any other questions before we log off here?
Jake Martin: No, that's it.
Chris Shafer: Okay, great.
I kind of want to end with you, you had mentioned you used the data to elevate people. And I, from all this, I'm going to say that is one thing that's going to really stick with me. And Michael, I'm going to use that quite a bit moving forward. So I really appreciate your time and your insights and you sharing how
you use backstage at Interior Architects. Thank you, Michael.
Michael Reinersman: Yep. All right. Thank you, everybody. Appreciate it.
Chris Shafer: Thanks, everyone.
Register for upcoming events or catch the recordings of past webinars.
Discover everything Guardian can do for your firm.
